17-Hour Period in V light from MAXI J1820+070 = ASASSN–18ey
J. Patterson (Columbia Univ.), S. Brincat (CBA-Malta), G. Stone (CBA-Sierras), J. Hambsch (CBA-Mol), M. Richmond (Rochester Inst. Tech.), J. Kemp (Middlebury Coll.), B. Monard (CBA-Kleinkaroo), D. Lemay (CBA-Quebec), S. Dvorak (CBA-Florida), J. Ulowetz (CBA-Illinois), T. Vanmunster (CBA-Belgium), T. Tordai (CBA-Hungary), G. Myers (CBA-San Mateo), T. Campbell (CBA-Arkansas), J. Rock (CBA-Wilts), I. Miller (CBA-Wales), D. Slauson (CBA-Iowa), D. Cejudo (CBA-Madrid), P. Lewin (CBA-Glendora), G. Roberts (CBA-Tennessee), M. Epstein-Martin (Columbia Univ.), M. Smith (Columbia Univ.)
We report time-series photometry of X-ray transient MAXI J1820+070 = ASASSN–18ey with the globally distributed small telescopes of the Center for Backyard Astrophysics (CBA; Patterson et al. 2013; MNRAS 434, 1902). Our photometry covers 88 of the 98 days since discovery on 11 March 2018. The average nightly time series was ~10 hours in duration, with various time resolutions ranging from 3 to 40 s. Most observations were in V light, with some unfiltered time series converted to V magnitudes by applying additive constants measured by simultaneous unfiltered and V magnitudes.
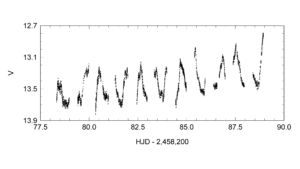
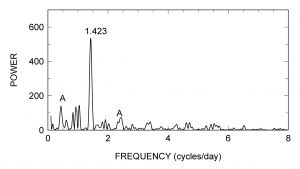
During the first 80 days of outburst, no persistent periodic signal was found, to a limit of 0.04 mag amplitude. There was weak evidence for a transient periodic signal with P~8 hours during several ~5-day segments of dense coverage. Starting ~5 June 2018, the star began to brighten and show obvious (0.4 mag full amplitude) waves with a period of 0.703 days. The power spectrum and light curve are shown below. Clued in to this period, we could discern this wave another ~5 days before it became obvious. Over a 20-night baseline, the star obeyed the strict ephemeris
Minimum light = HJD 2,458,281.595(10) + 0.703(3) E.
We also saw ~10 s QPOs early in the outburst, as did many other optical and X-ray observers. The phase stability of the 0.703 d wave makes it a good candidate for the orbital period of the underlying compact binary, although other interpretations (superhump? precession?) are possible. Spectroscopic observation could test this hypothesis, and ascertain the dominant light source in the binary.
Figure 1. Light curve of ASASSN–18ey during 9–18 June 2018.
Figure 2. Power spectrum of the light curve. An obvious signal at 1.423(8) cycles/day is present, along with 1-day aliases (designated “A”) and a signal near 1 cycle/day which arises purely from the sampling.


