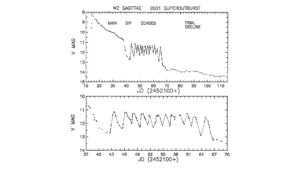
WZ Sagittae by the CBA
Upper frame: Eruption light curve of WZ Sge in 2001, showing a rapid rise to V = 8.2 and subsequent decay at ∼0.10 mag day^–1, punctuated by an episode of 12 “echo outbursts.” Lower frame: Expanded view of the echo episode. A freehand curve has been added to improve visibility. (Figure 1 from Patterson, J., et al. 2002, PASP, 114, 721.)
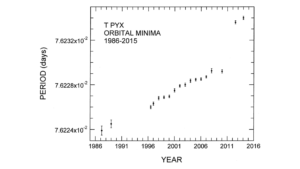
T Pyxidis by the CBA
The variation of P_orb during 1986–2015. Each point represents a two-year running mean. Day zero of the eruption occurred at 2011.4. (Figure 6 from Patterson, J. et al. 2017, MNRAS, 466, 581.)
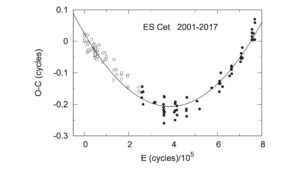
ES Ceti by the CBA
O-C diagram of the timings of minimum light, relative to the test ephemeris: HJD 2,452,201.3941 + 0.00717838E. Filled symbols indicate new measurements from Table 1. Open symbols indicate measurements from EPWW and C2011. The fitted parabola corresponds to Eq. 1, which indicates a period increase with P/P-dot = 6.2(2) x 10^6 yr. (Figure 1 from de Miguel, E., et al. 2018, ApJ, 852, 19.)
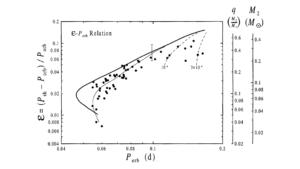
Cataclysic Variables by the CBA
Empirical correlation of ɛ with P_orb for apsidal superhumpers. The bold solid curve shows the trend expected from the KB99 prescription (J-dot = J-dot_GR ). The “error bar” shows the range expected for a +-20% scatter in M_1, plus the uncertainty in ɛ(q). The dashed curves at upper right show the effects of inflicting a constant M-dot (in M_sol yr^-1) on the binary; these effects are large, since the secondary is then driven far from thermal equilibrium. The light solid curve shows the effect of an enhanced J-dot (=3J-dot_GR); alternative ways of oversizing the secondary (heating, adjustment of the M-R relation) produce a similar result. (Figure 3 from Patterson, J. 2001, PASP, 113, 736.)
V803 Centauri by the CBA
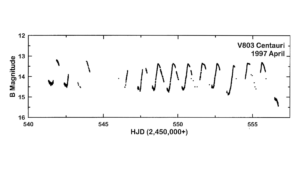
The continuous light curve during 1997 April 2–17, spliced from the SAAO 0.75 m, the CTIO 0.9 m, the CBA-Awanui 0.25 m, and the Stubbings 0.32 m telescopes. Easily apparent is a quasi-regular variation of ~1.1 mag amplitude and 23 hr period ; we interpret this as the "normal eruption" cycle of a helium dwarf nova. (Figure 4 from Patterson, J., et al. 2000, PASP, 112, 625.)
EG Cancri by the CBA
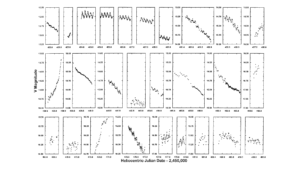
Nightly time series for 1996 December–1997 February. The time and magnitude scale is uniform in all frames. (Figure 3 from Patterson, J., et al. 1998, PASP, 110, 1290.)
Cataclysic Variables by the CBA
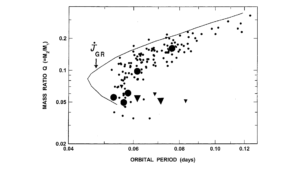
Mass ratio q versus P_orb. Dots are positive measurements from eclipsers and superhumps; triangles are upper limits on q from radialvelocity studies. The curve is the predicted trend if CV evolution is driven by angular-momentum loss at the gravitational-radiation (GR) rate, assuming X = 0.7 and M_1 = 0.8 M_sol. The error in q is likely to be ~15 per cent on the upper branch (say q > 0.10), and somewhat higher on the lower branch. (Figure 6 from Patterson, J. 2011, MNRAS, 411, 2695.)
BK Lyncis by the CBA
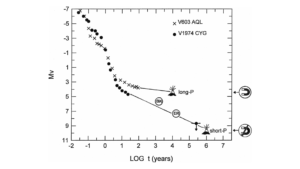
Road map for the decline of fast classical novae, for stars with P_orb < 2.4 h (‘short’) and 2.8 h < P_orb +9 limit from its pre-outburst non-detection). The two named dwarf novae are BK Lyn and the average of the other seven ER UMa stars in Table 4 (assuming the 2000 and 15,000 yr ages, respectively, argued for in this paper). Long-P_orb stars are assumed to be driven by magnetic braking, which will produce an eruption in ~10^4 yr since it provides M-dot ~ 10^−8 M_sol yr^−1. Short-P_orb stars must wait ~10^6 yr, since they must rely on GR, which provides only 10^−10 M_sol yr−1. (Figure 7 from Patterson, J., et al. 2013, MNRAS, 434, 1902.)
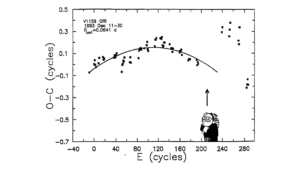
V1159 Orionis by the CBA
O-C diagram of the timings of the superhump's principal minimum, with respect to the mean period of 0.0641 d. Timings during days 35-50 are fit with the parabola shown, which is Eq. (3). The arrow points to a data gap due to Observatory shutdown. (Figure 7 from Patterson, J., et al. 1988, PASP, 107, 1183.)
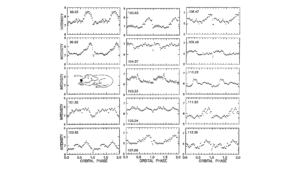
WZ Sagittae by the CBA
Nightly orbital light curves during final decline, with dates of mid-observation identified in each frame. Most frames have 50 phase bins per orbit, with all bins independent (no smoothing). The light curves tend to repeat with a cycle of ~5 days. On day 100, we let sleep the dogs of war. (Figure 14 from Patterson, J., et al. 2002, PASP, 114, 721.)
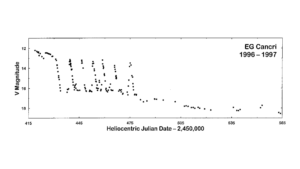
EG Cancri by the CBA
Light curve of EG Cnc during the 1996/1997 eruption. (Figure 1 from Patterson, J., et al. 1998, PASP, 110, 1290.)
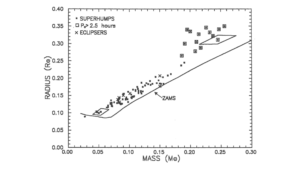
Cataclysmic Variables by the CBA
Mass-radius dependence for secondary stars in CVs. Filled squares are (M_2, R_2) pairs deduced from superhumps. Diamonds show typical errors in the short-P_orb and long-P_orb regimes. Crosses are values independently deduced in eclipsing binaries (from Table 8). Enclosing boxes denote "long-period" stars (>2.5 hr). The curve shows the M-R dependence on the ZAMS (Baraffe et al. 1998), extended to lower mass with the brown dwarf models of Burrows et al. (1993). All CV secondaries are slightly too big to be ZAMS stars, but there is an apparent discontinuity near 0.20 M_sol. (Figure 10 from Patterson, J., et al. 2005, PASP, 117, 1204.)
Cataclysic Variables by the CBA
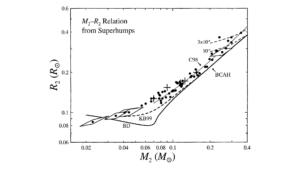
CV secondaries in the mass-radius plane. Dots are values calculated from precession rates. Crosses are precise (M_2, R_2) values from eclipsing dwarf novae. The light line is a fit to the empirical mass-radius relation in the C98 study, while the BCAH curve is the theoretical ZAMS of Baraffe et al. (1998), extended to lower mass with the (c)old solar-abundance brown dwarf models of Burrows et al. (1993). This extension is labeled “BD” to indicate cold brown dwarfs. The dashed KB99 curve shows theoretical departures from the extended BCAH curve as a result of increasing thermal imbalance in the secondary as it evolves toward lower mass. The dashed curves at upper right show the effects on mass-radius for two fixed mass-transfer rates (in M_sol yr^-1), calculated by BK00. Actual CV secondaries of M_2 > 0.08 M_sol appear to follow C98 very well but are ~10%–30% larger than BCAH stars. Diamonds show explicit errors for the four stars of greatest interest and also a typical error. [The error is dominated by the expected dispersion in M_1(+-0.16 M_sol); the errors in M_2 and R_2 are highly correlated because P_orb specifies M_2/R_2^3 to high accuracy.] (Figure 2 from Patterson, J. 2001, PASP, 113, 736.)
AM Canum Venaticorum by the CBA
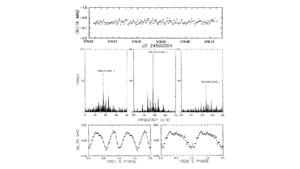
Top panel: a sample light curve of white-light CBA photometry. Each point is a 60 s integration. The 525 s variations are occasionally but barely
visible in the raw light curve. Middle panels: power spectrum of the 1997 light curve. Significant peaks are marked with their period in seconds. The signals at 525.65 and 350.43 s are just the usual harmonics of the main signal, but the signal at 1028.74 s appears to be a new feature. Bottom left panel: 1997 light curve summed at 1051.30 s. The double-humped waveform agrees in detail with all previous studies, indicating that 1051.3 s is indeed the fundamental period of the main signal (although most of the power is clearly at the first harmonic, 525 s). Bottom right panel: 1997 light curve summed at 1028.733 s. (Figure 1 from Harvey, D., et al. 1988, ApJ, 493, L105.)
Cataclysic Variables by the CBA
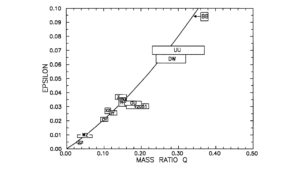
Variation of ε with q in the stars of Table 7. The limit for BB Dor (q<0.38) is set by the requirement that it should have a lower q than U Gem, since the latter (probably) does not
superhump. The fitted quadratic curve is Eq. (8). (Figure 9 from Patterson, J., et al. 2005, PASP, 117, 1204.)
Cataclysic Variables by the CBA
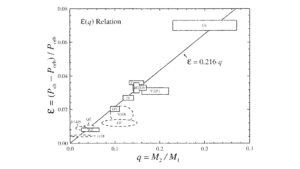
Boxes are empirical measures of e and q in eight eclipsing CVs, with data taken from Table 1. Ovals are more uncertain measures of e and q in four superhumping X-ray binaries; these serve mainly to stress that low e implies low q generally. The fitted straight line is based only on the eclipsing CVs. (Figure 1 from Patterson, J. 2001, PASP, 113, 736.)
