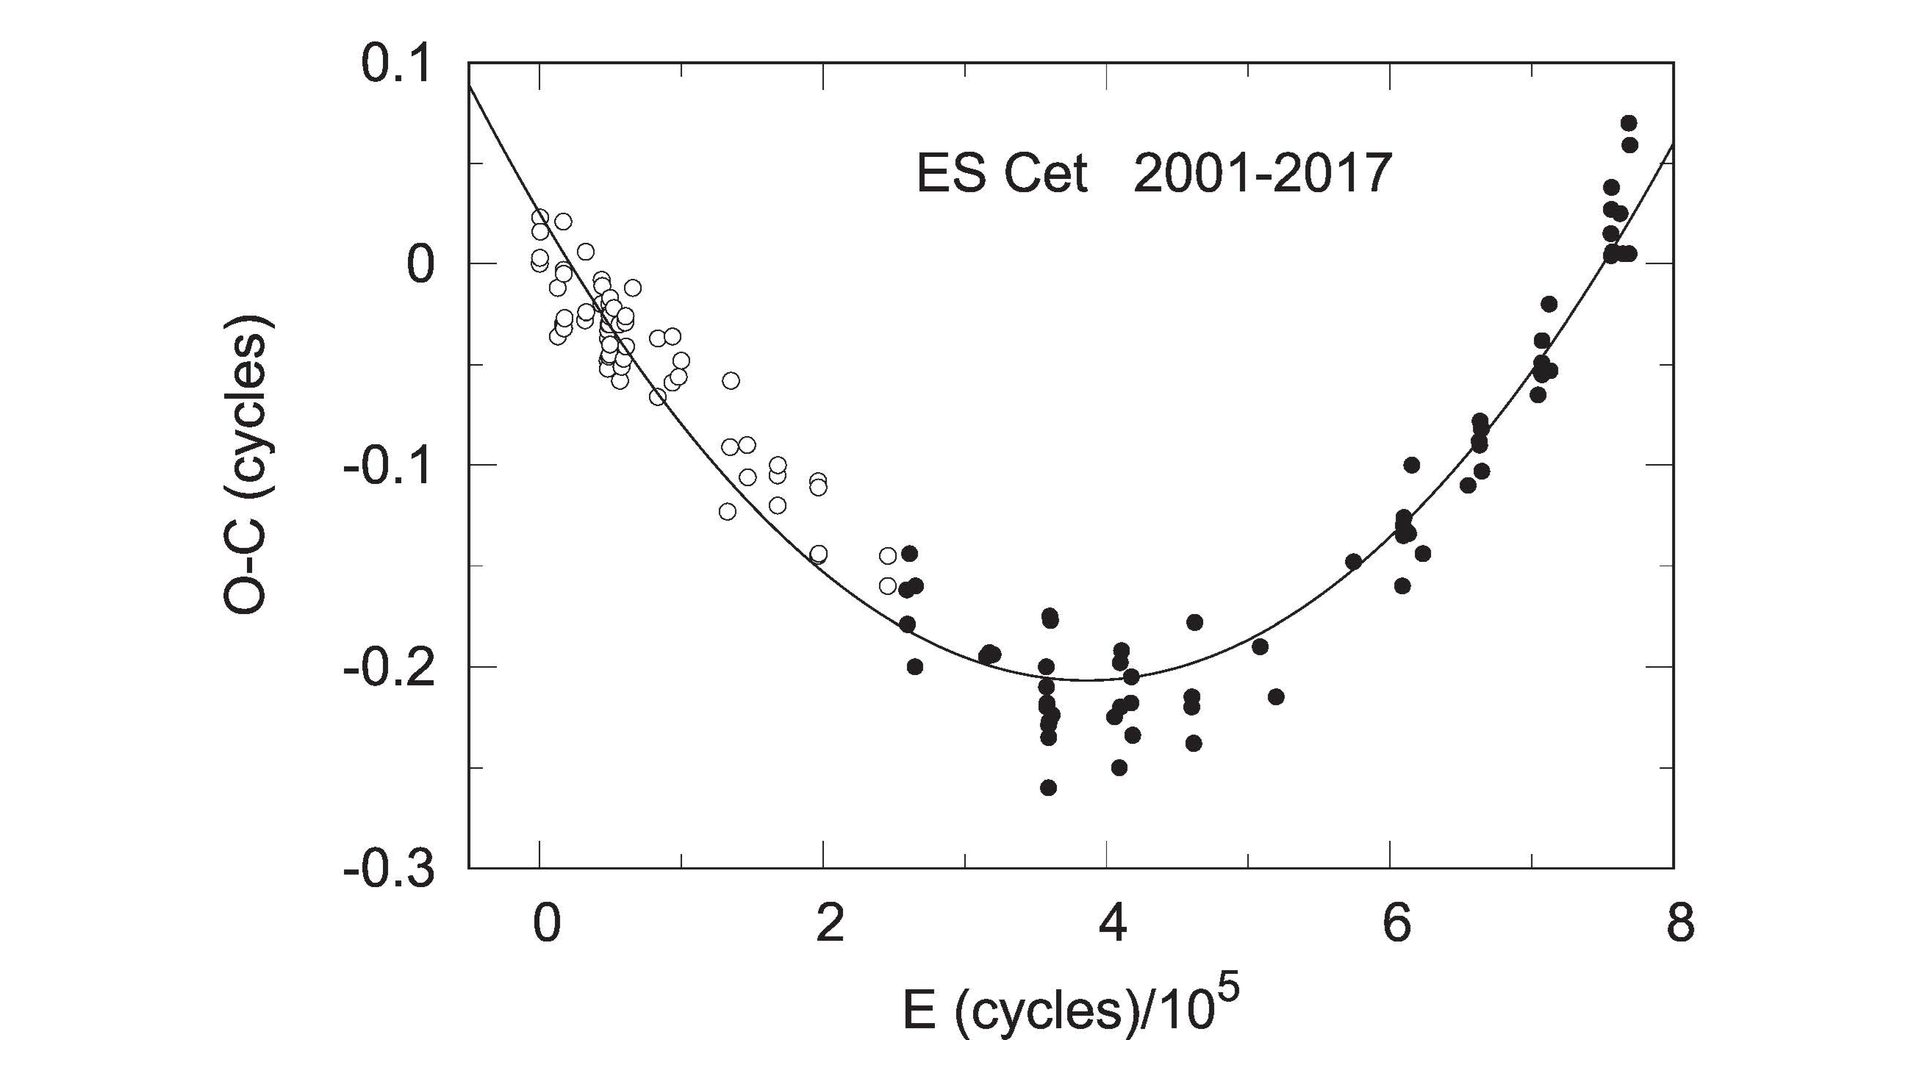
O-C diagram of the timings of minimum light, relative to the test ephemeris: HJD 2,452,201.3941 + 0.00717838E. Filled symbols indicate new measurements from Table 1. Open symbols indicate measurements from EPWW and C2011. The fitted parabola corresponds to Eq. 1, which indicates a period increase with P/P-dot = 6.2(2) x 10^6 yr. (Figure 1 from de Miguel, E., et al. 2018, ApJ, 852, 19.)