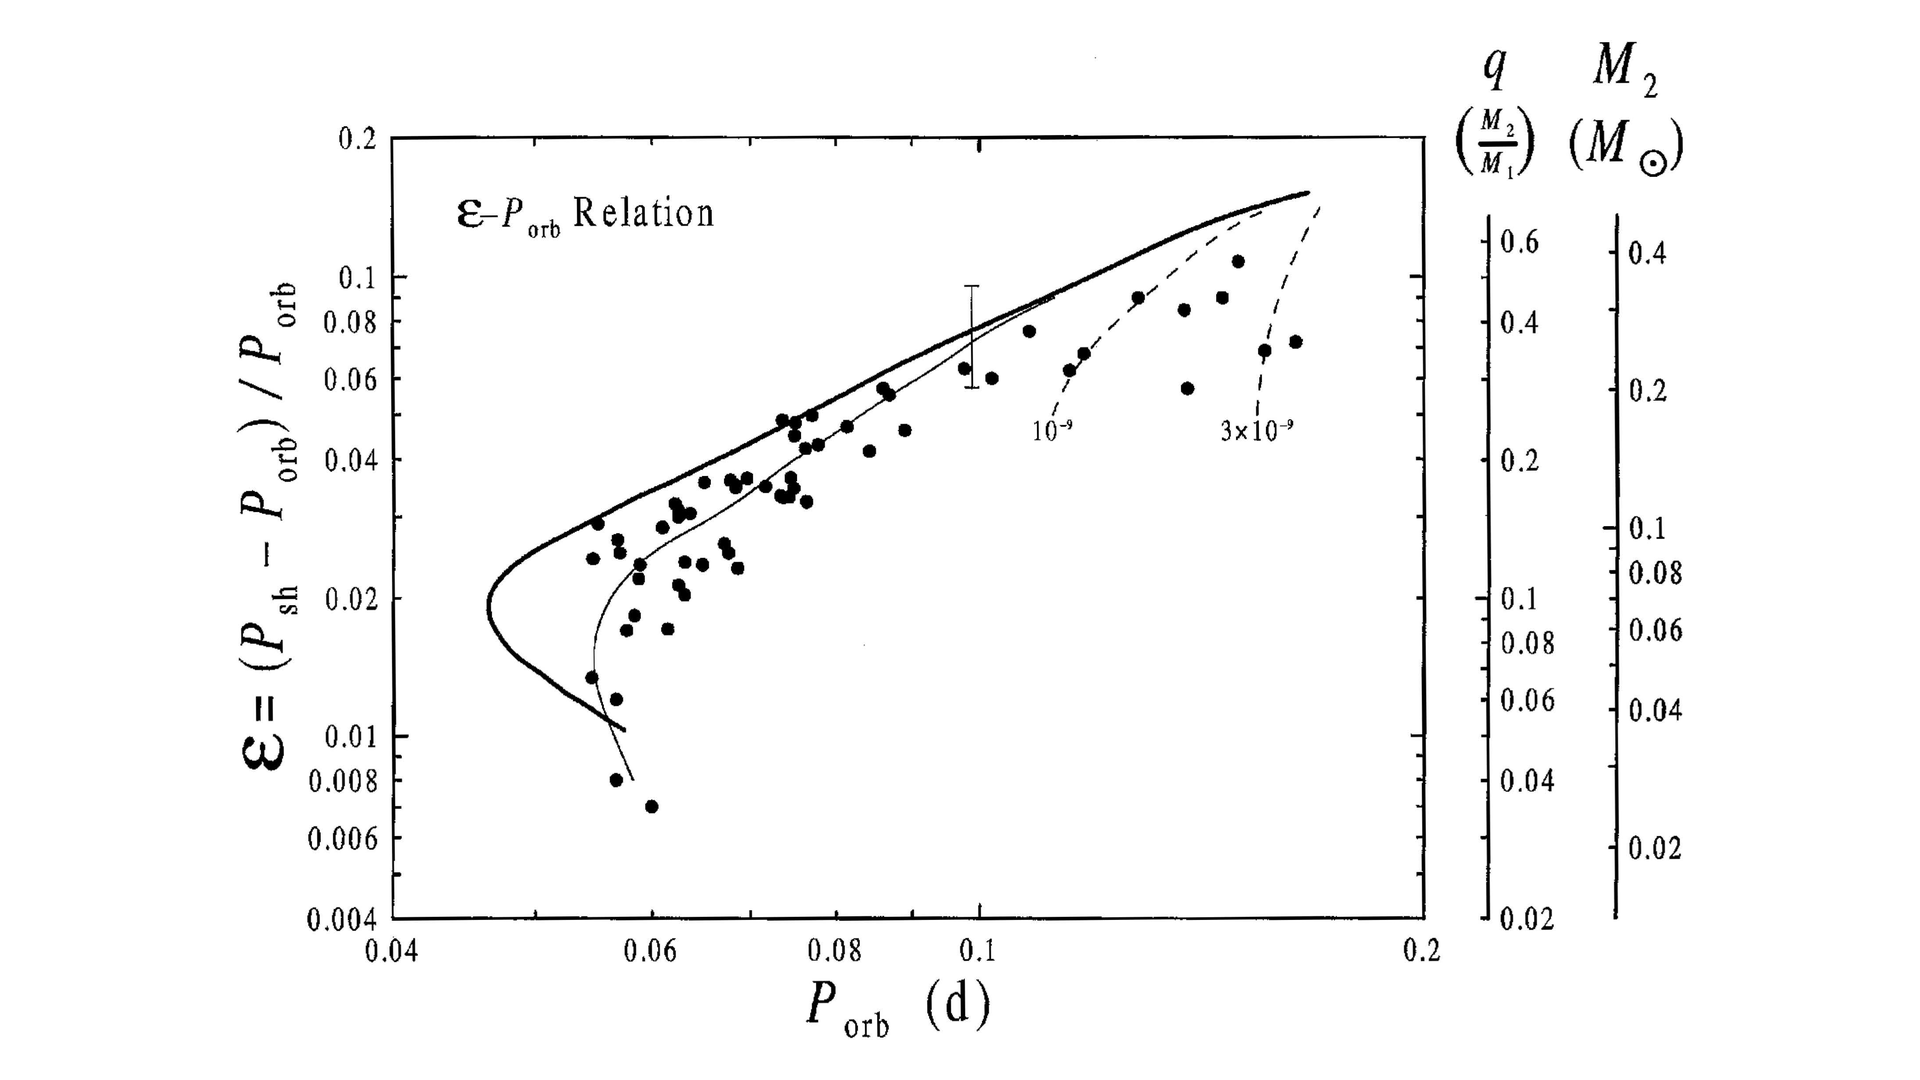
Empirical correlation of ɛ with P_orb for apsidal superhumpers. The bold solid curve shows the trend expected from the KB99 prescription (J-dot = J-dot_GR ). The “error bar” shows the range expected for a +-20% scatter in M_1, plus the uncertainty in ɛ(q). The dashed curves at upper right show the effects of inflicting a constant M-dot (in M_sol yr^-1) on the binary; these effects are large, since the secondary is then driven far from thermal equilibrium. The light solid curve shows the effect of an enhanced J-dot (=3J-dot_GR); alternative ways of oversizing the secondary (heating, adjustment of the M-R relation) produce a similar result. (Figure 3 from Patterson, J. 2001, PASP, 113, 736.)