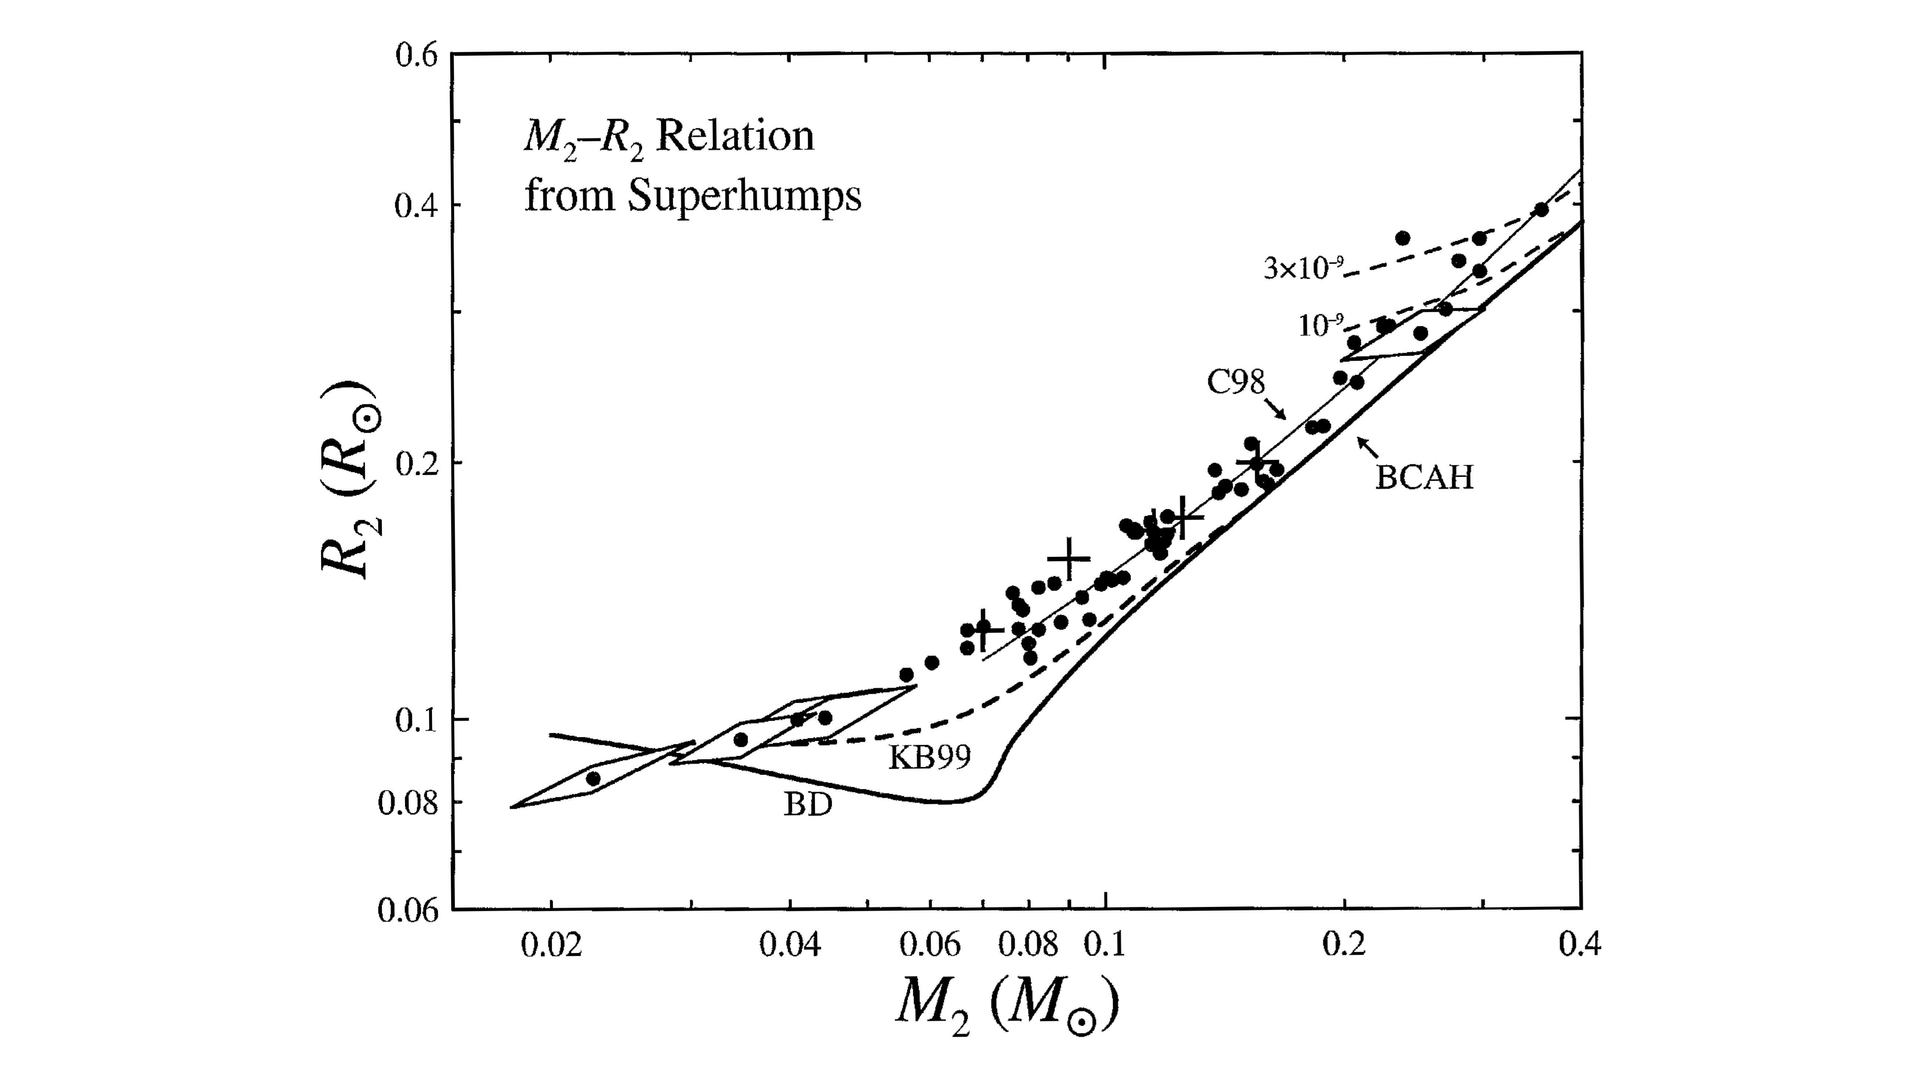
CV secondaries in the mass-radius plane. Dots are values calculated from precession rates. Crosses are precise (M_2, R_2) values from eclipsing dwarf novae. The light line is a fit to the empirical mass-radius relation in the C98 study, while the BCAH curve is the theoretical ZAMS of Baraffe et al. (1998), extended to lower mass with the (c)old solar-abundance brown dwarf models of Burrows et al. (1993). This extension is labeled “BD” to indicate cold brown dwarfs. The dashed KB99 curve shows theoretical departures from the extended BCAH curve as a result of increasing thermal imbalance in the secondary as it evolves toward lower mass. The dashed curves at upper right show the effects on mass-radius for two fixed mass-transfer rates (in M_sol yr^-1), calculated by BK00. Actual CV secondaries of M_2 > 0.08 M_sol appear to follow C98 very well but are ~10%–30% larger than BCAH stars. Diamonds show explicit errors for the four stars of greatest interest and also a typical error. [The error is dominated by the expected dispersion in M_1(+-0.16 M_sol); the errors in M_2 and R_2 are highly correlated because P_orb specifies M_2/R_2^3 to high accuracy.] (Figure 2 from Patterson, J. 2001, PASP, 113, 736.)