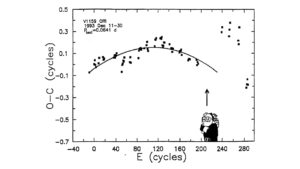
O-C diagram of the timings of the superhump’s principal minimum, with respect to the mean period of 0.0641 d. Timings during days 35-50 are fit with the parabola shown, which is Eq. (3). The arrow points to a data gap due to Observatory shutdown. (Figure 7 from Patterson, J., et al. 1988, PASP, 107, 1183.)

