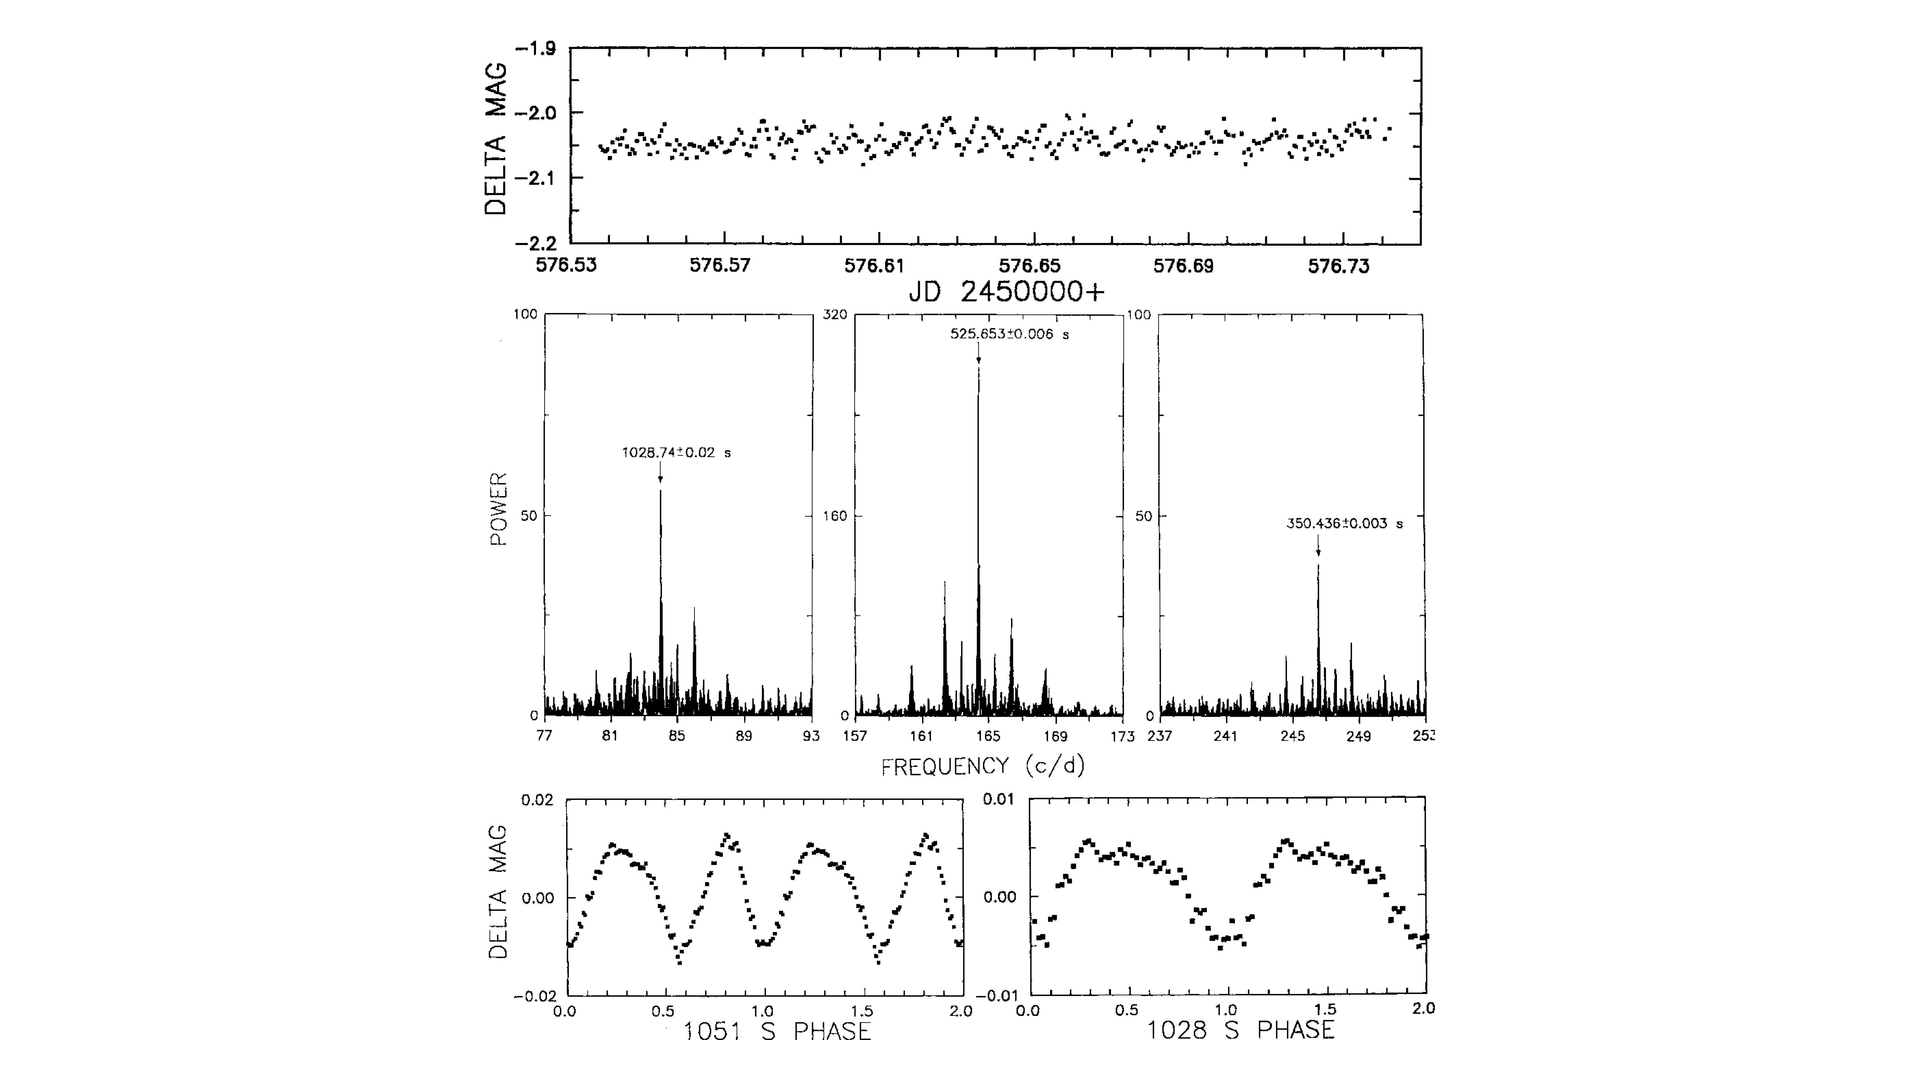
Top panel: a sample light curve of white-light CBA photometry. Each point is a 60 s integration. The 525 s variations are occasionally but barely
visible in the raw light curve. Middle panels: power spectrum of the 1997 light curve. Significant peaks are marked with their period in seconds. The signals at 525.65 and 350.43 s are just the usual harmonics of the main signal, but the signal at 1028.74 s appears to be a new feature. Bottom left panel: 1997 light curve summed at 1051.30 s. The double-humped waveform agrees in detail with all previous studies, indicating that 1051.3 s is indeed the fundamental period of the main signal (although most of the power is clearly at the first harmonic, 525 s). Bottom right panel: 1997 light curve summed at 1028.733 s. (Figure 1 from Harvey, D., et al. 1988, ApJ, 493, L105.)